

Advanced Certificate in Python for Real-Time Data Visualization
Master Python for real-time data visualization with this certificate, enhancing skills in dynamic data presentation and analysis.
Advanced Certificate in Python for Real-Time Data Visualization
Programme Overview
This course is tailored for data scientists, software developers, and analysts looking to enhance their skills in creating real-time data visualizations using Python. Participants will gain proficiency in utilizing libraries like Plotly, Bokeh, and Dash to build dynamic and interactive visualizations. By the end, learners will be able to implement real-time data streaming, integrate web applications, and optimize visualizations for performance and user experience.
Students will also deepen their understanding of Python programming, data manipulation with pandas, and backend deployment techniques, all while working on practical projects that mirror real-world challenges.
What You'll Learn
Dive into the dynamic world of real-time data visualization with our Advanced Certificate in Python for Real-Time Data Visualization. This intensive course equips you with the skills to harness Python’s powerful libraries, like Matplotlib, Plotly, and Bokeh, to create interactive and responsive visualizations that bring data to life. Whether you're a seasoned programmer looking to specialize or a data enthusiast eager to enhance your skills, this course offers hands-on training and real-world case studies to boost your portfolio. With a focus on live data streaming and advanced analytics, you'll gain the expertise to tackle complex data challenges and communicate insights effectively. Join us and transform data into dynamic visual stories that drive decision-making and innovation. Open doors to careers in data science, financial analysis, and tech development with this cutting-edge certificate.
Programme Highlights
Industry-Aligned Curriculum
Developed with industry leaders to ensure practical, job-ready skills valued by employers worldwide.
Globally Recognised Certificate
Recognised by employers across 180+ countries as a mark of professional excellence.
Flexible Online Learning
Study at your own pace with lifetime access to all course materials and updates.
Instant Access
Start learning immediately — no application process or waiting period required.
Constantly Updated Content
Stay ahead with the latest industry trends, best practices, and emerging insights.
Career Advancement
87% of graduates report measurable career progression within 6 months of completion.
Topics Covered
- 1. Introduction to Python for Data Visualization: Learners will be introduced to Python fundamentals and popular libraries like Matplotlib and Seaborn. They will gain skills in setting up development environments and creating basic visualizations.
- 2. Data Manipulation with Pandas: This module covers data handling in Python using Pandas, including data cleaning, manipulation, and preparation for visualization. Learners will develop skills to manage and preprocess real-world datasets.
- 3. Advanced Matplotlib Techniques: Focusing on advanced plotting techniques and customization in Matplotlib, learners will explore various plot types, styles, and color schemes to create compelling visual representations of data.
- 4. Interactive Visualizations with Plotly: Learners will learn to create interactive and dynamic visualizations using Plotly. They will understand how to build interactive charts, dashboards, and maps, enhancing the interpretability of data.
- 5. Real-Time Data Streams: This module introduces the concept of real-time data processing and visualization. Learners will work with live data streams and understand the challenges and solutions for real-time data visualization.
- 6. Time Series Analysis and Visualization: Focusing on time-series data, learners will study techniques for analyzing and visualizing temporal data. They will gain skills in plotting time series, detecting trends, and forecasting using Python.
- 7. Geographic Data Visualization: Learners will explore libraries like Geopandas and Folium for geographic data visualization. They will learn to create maps, overlay geographic data, and perform spatial analysis.
- 8. Advanced Styling and Layouts: This module covers advanced styling and layout techniques to improve the aesthetic and layout of visualizations. Learners will learn to create more sophisticated and publication-quality visualizations.
- 9. Real-Time Data Visualization Projects: Through practical projects, learners will apply their skills to real-world scenarios, focusing on creating real-time visualizations for different types of data and scenarios.
- 10. Case Studies and Industry Best Practices: In this final module, learners will study case studies of real-world applications of real-time data visualization. They will learn industry best practices and strategies for implementing data visualization in professional settings.
What You Get When You Enroll
Secure checkout • Instant access • Certificate included
Key Facts
Audience: Data analysts, developers, researchers
Prerequisites: Basic Python knowledge
Outcomes: Real-time data visualization skills, dashboard creation
Ready to get started?
Join thousands of professionals who already took the next step. Enroll now and get instant access.
Enroll Now — $149Why This Course
Enhance Data Interpretation Skills: Gain expertise in real-time data visualization, enabling you to interpret complex data sets more effectively and communicate insights clearly to stakeholders.
Boost Career Prospects: Stand out in the job market with a specialized skill set in Python for real-time data visualization, making you a valuable asset to data-driven organizations.
Practical Application: Apply knowledge through hands-on projects, directly working with real-time data, which provides invaluable experience and prepares you for professional challenges.
Your Path to Certification
Trusted by Professionals Worldwide
Course Brochure
Download our comprehensive course brochure with all details
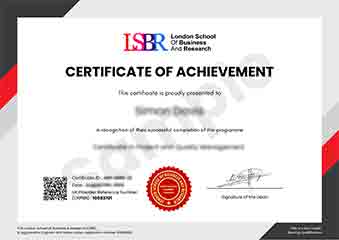
Sample Certificate
Preview the certificate you'll receive upon successful completion of this program.
Get Free Course Info
Enter your details and we'll send you a comprehensive course information pack straight to your inbox.
Employer Sponsored Training
Let your employer invest in your professional development. Request a corporate invoice and get your training funded.
Request Corporate InvoiceWhat People Say About Us
Hear from our students about their experience with the Advanced Certificate in Python for Real-Time Data Visualization at FlexiCourses.
James Thompson
United Kingdom"The course content is incredibly thorough, covering everything from basic data visualization techniques to advanced real-time data streaming integration. Gained practical skills that have directly enhanced my ability to create dynamic visualizations for real-world applications, which is a huge asset in the tech industry."
Ahmad Rahman
Malaysia"This Advanced Certificate in Python for Real-Time Data Visualization has been a game-changer for my career. Not only did it equip me with the latest tools and techniques in real-time data visualization, but it also showed me how to apply these skills to solve complex problems in my field, making me more competitive in the job market."
Siti Abdullah
Malaysia"The course structure is well-organized, providing a seamless transition from foundational concepts to advanced techniques in real-time data visualization, which has significantly enhanced my ability to apply Python in practical scenarios."